
Shocktober: Seven charts that tell the story of the stock market’s worst month in six years
World stock markets fell 7.4 per cent in October as investors fretted about issues such as US-China trade tensions, European political uncertainty and the end of quantitative easing.
The sell-off made it the worst monthly performance for stocks globally in the last six years and it’s the tenth worst in the last decade, as measured by the MSCI World Index. To put that into perspective, the nine worst months all came during or as a result of the global financial crisis.
10 worst monthly performances of the last decade
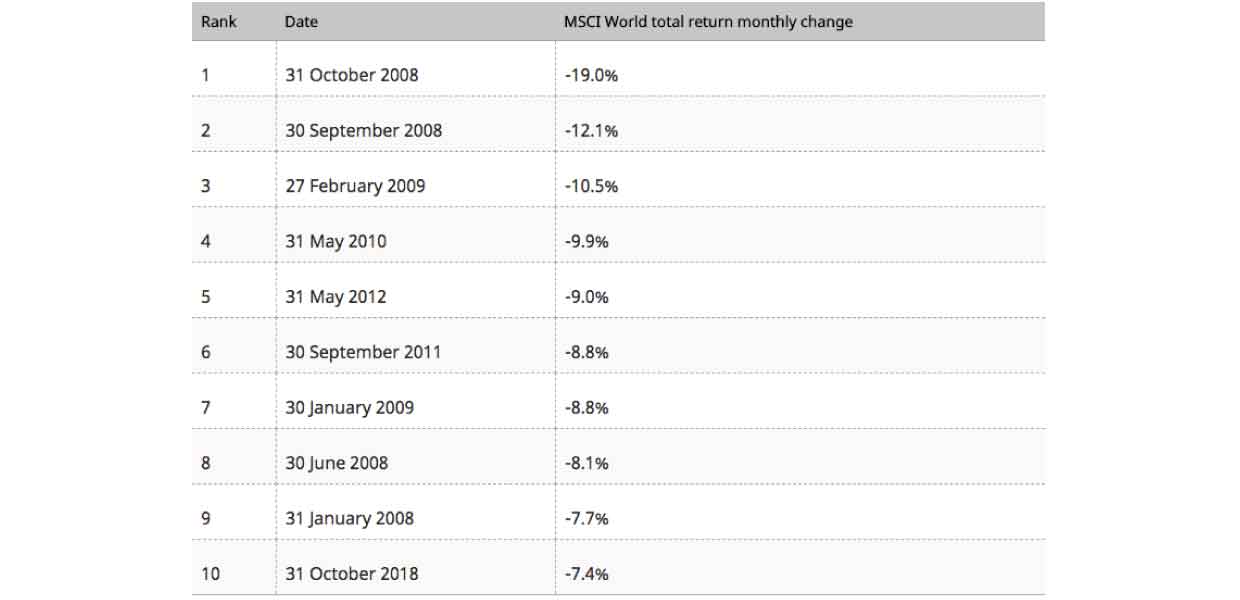
Please remember that past performance is not a guide to future performance and may not be repeated. (Source: Schroders, Thomson Reuters Datastream data for the MSCI World price index in dollar terms correct as at 1 November 2018.)
Historically, October has been a good month for stock market investors but when there is a bad month, it tends to be really bad:
- Since 1992 the market has only fallen in five Octobers
- But since 1984, seven of the ten largest ever one-day falls have occurred in October (largest on 20 October 1987)
- Since 2000 the average return for October has been 1.8 per cent, making it second best month for returns after April
Regionally, most markets neared correction territory this October. A correction is when there has been a fall of 10 per cent or more. Emerging markets are nearing a bear market, which is a fall of 20 per cent or more.
Japanese stocks fared the worst this October, falling 9.1 per cent. Emerging market stocks fell 8.8 per cent and European stocks fell 5.3 per cent. US stocks were down 7 per cent, while UK stocks performed the best of the major markets, but were still down 5.1 per cent.
A strong dollar (more of which later) tends to help the UK stock market. Many of the companies listed in the UK earn their revenues abroad, so when the dollar is strong and the pound is weak they make more money when they convert their earnings back into sterling.
However, the sell-off has made stock market valuations more attractive.
Price-to-earnings (P/E) ratios (one of the most widely used valuation measures) of all the major markets have come down significantly this year.
P/E is calculated by dividing a stock market’s value or price by the aggregate earnings per share of all the companies over the next 12 months. A low number represents better value.
Regional stock market valuations now vs 2018 high
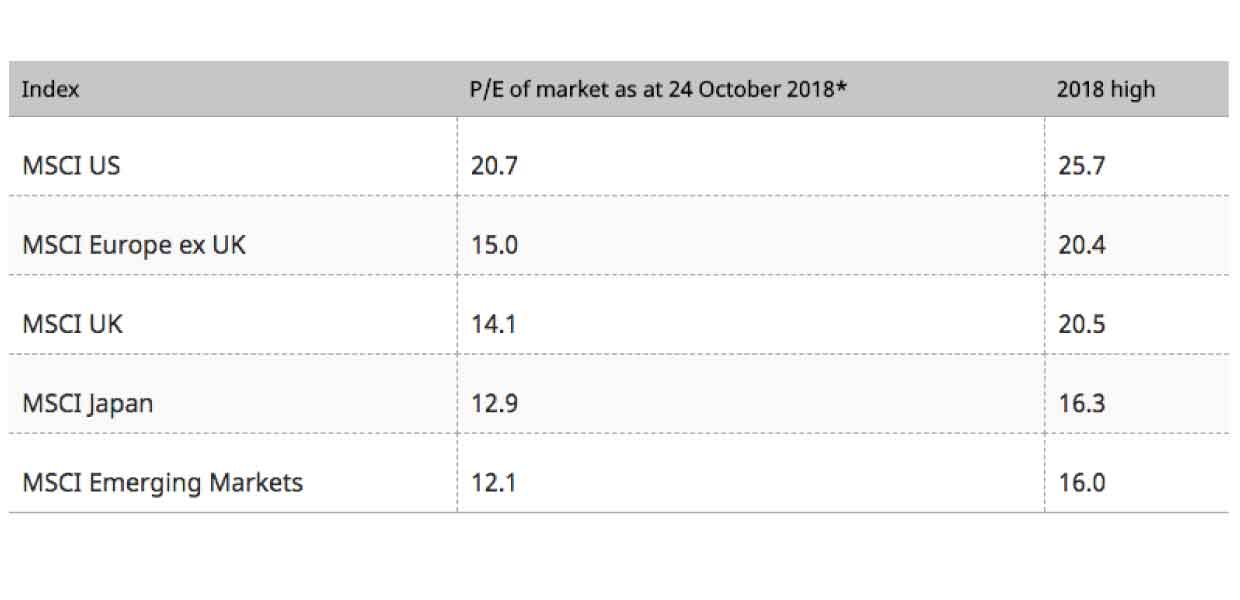
(Source: Schroders. Valuation data is released monthly. 24/10/2018 figure has been estimated by taking the end of September figure and rolling it forwards using price changes between those dates. Due to data limitations, no account has been taken of any changes to earnings, book values or dividends between these dates. However, any such changes are likely to be small and immaterial in this context.)
The sectors that performed the worst (and best)
So-called growth sectors such as technology suffered, but it was those exposed to the fortunes of the global economy that were hit hardest. Construction, materials and basic resources all fell by high single digit or low double digit percentages.
Outperforming the market, but still falling, were those defensive sectors such as tobacco, utilities and food & drug retail. These sectors tend to perform well in turbulent periods because demand for the products they produce remains consistent whether times are good or bad.
How the sectors performed in October 2018
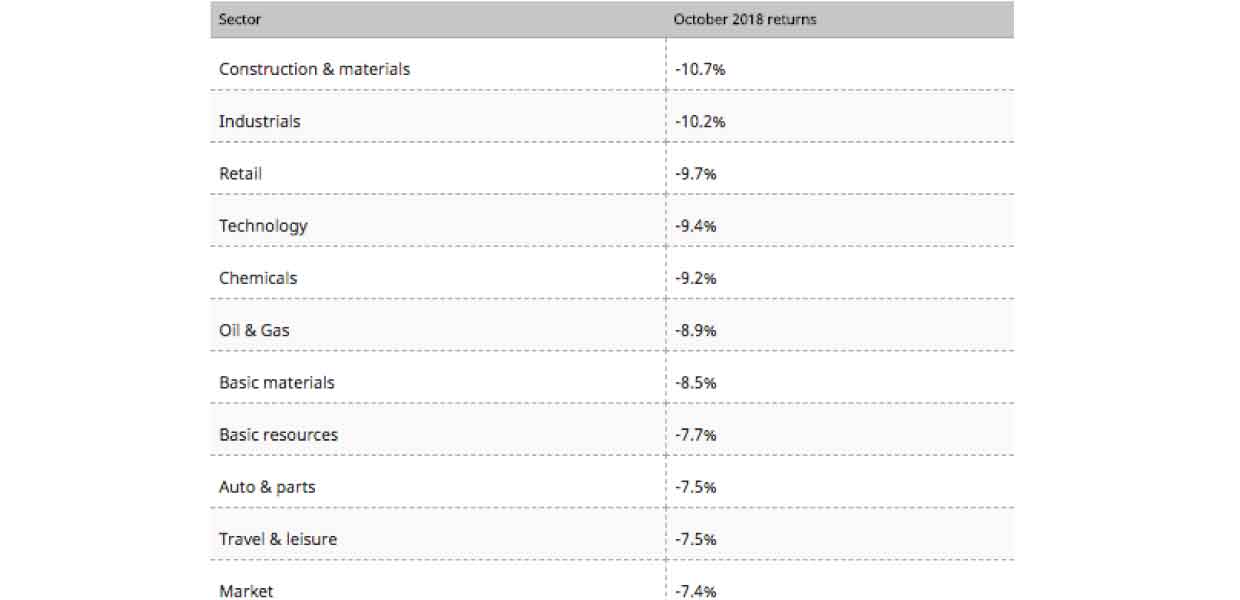
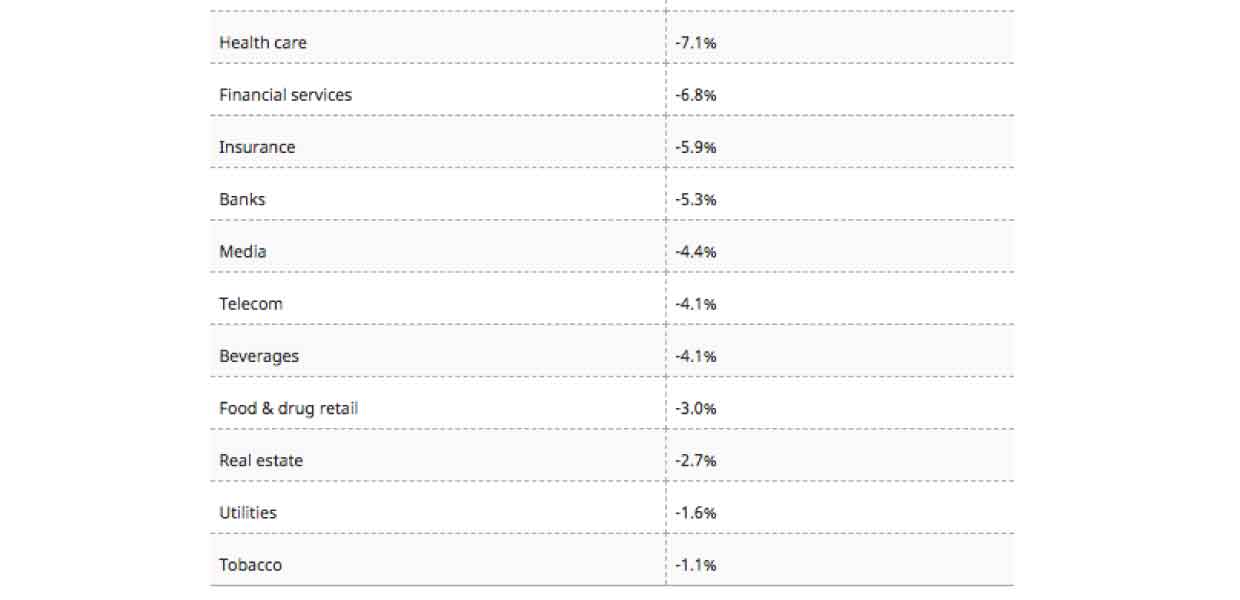
Please remember that past performance is not a guide to future performance and may not be repeated. (Source: Schroders, Thomson Reuters Datastream data for the Thomson Reuters Global Index return, including dividends, priced in dollar terms correct as at 1 November 2018.)
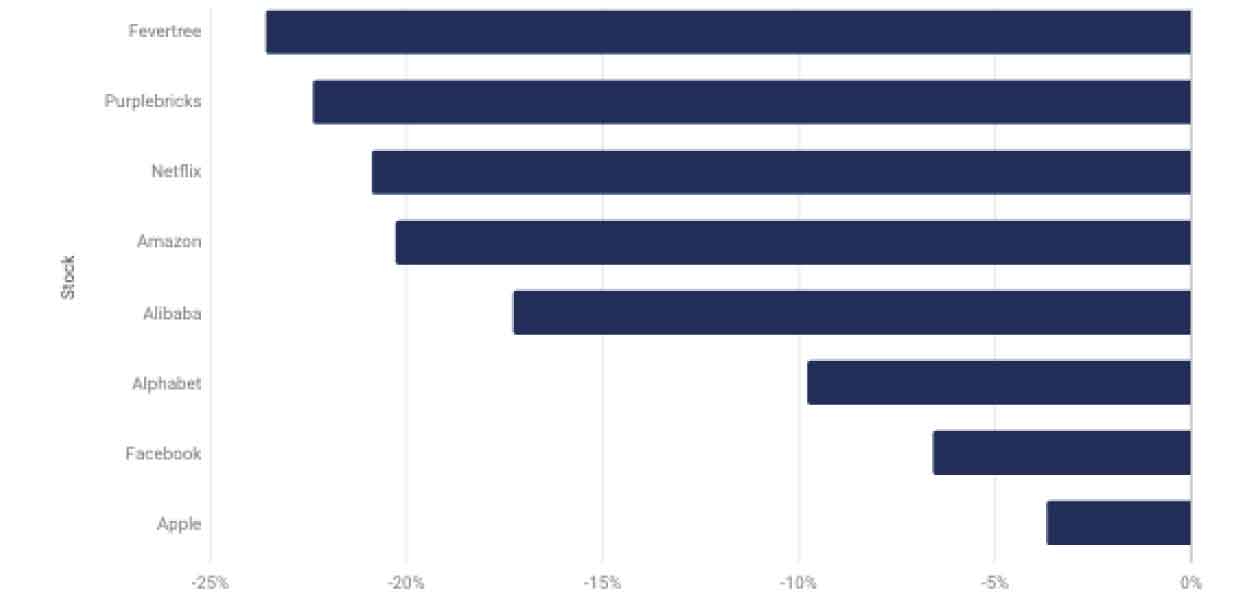
FAANGs and other growth stocks suffer
The FAANGs (Facebook, Amazon, Apple, Netflix, Google/Alphabet) fell in October, along with other classic growth stocks such as Alibaba, China’s equivalent of Amazon, or the UK drinks-maker Fevertree.
In bull markets, growth stocks tend to rise at a much faster pace than the overall market, because investors become increasingly comfortable with risk when times are good. Conversely, growth stocks tend to decline at a more rapid rate in bear markets as investors seek to reduce their risk profile.
How some growth stocks suffered in October 2018
Please remember that past performance is not a guide to future performance and may not be repeated. (Source: Schroders, Thomson Reuters Datastream. Performance for each stock priced in local currency. Data correct as at 1 November 2018.)
To illustrate the point, while valuations have fallen they remain high for some growth stocks.
The table below shows the price-to-earnings (P/E) ratios (one of the most widely used valuation measures) for the FAANGs and Fevertree compared to the MSCI World Index.
P/E is calculated by dividing a stock’s value or price by its earnings per share over the next 12 months. A low number represents better value.
How growth company valuations have changed in 2018
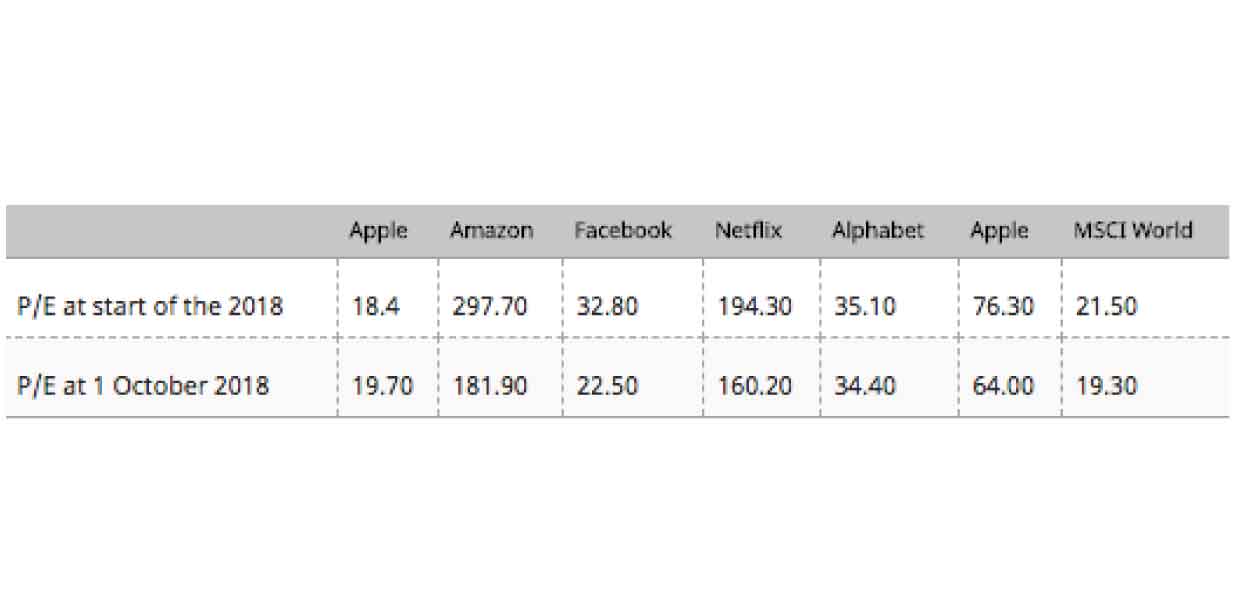
(Source: Source: Schroders, Thomson Reuters Datastream data correct as at 1 November 2018.)
The dollar continues to rise
The dollar index is at its highest point in 2018 and rose sharply in October. The dollar is seen as a safe haven for investors.
“Safe haven” currencies are ones investors tend to buy and hold during periods of uncertainty because they are perceived to be less risky and often appreciate in such conditions. Characteristics of a safe haven currency include strong country finances, strong economic growth, a stable political system and they can be easily bought and sold, although no investment is risk free.
The rise of the dollar in 2018
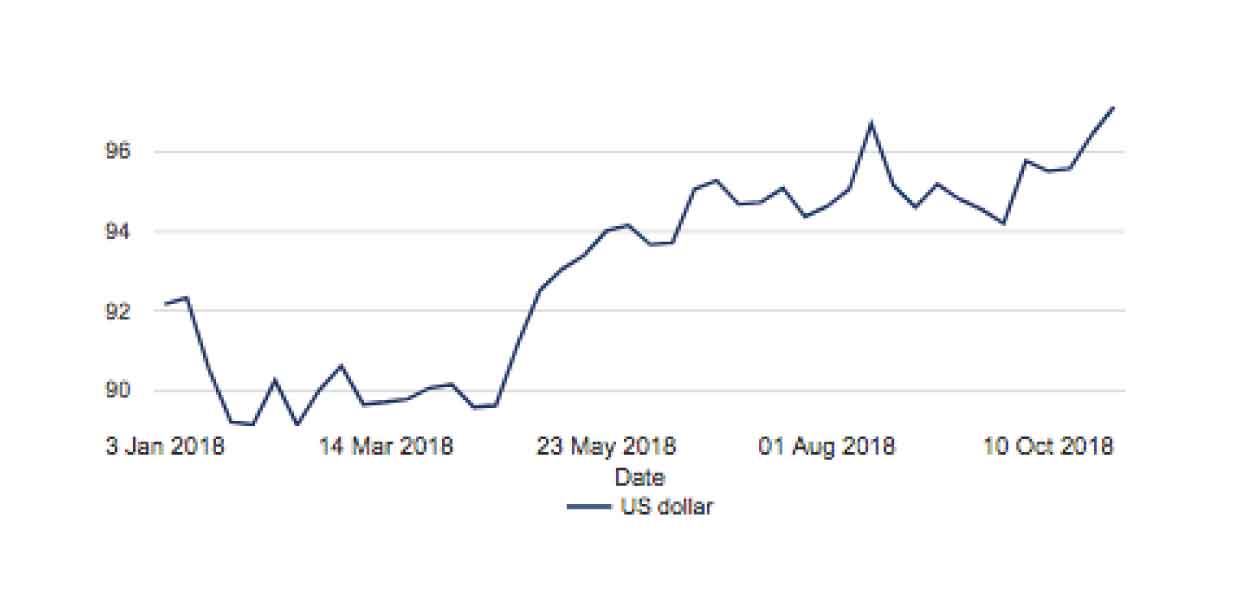
Please remember that past performance is not a guide to future performance and may not be repeated. (Source: Schroders, Thomson Reuters Datastream. Data correct as at 1 November 2018.)
The mixed performance of commodities
Oil sold off sharply in October, while copper continued its recent weak trend. Both of these commodities tend to perform better when the prospects for the global economy are good.
In contrast, gold remained steady despite the rise of the US dollar. Being priced in dollars, gold tends to suffer when the dollar is strong because it becomes more expensive to buy.
However, in turbulent times gold can be considered attractive due to its tangible qualities and the fact it tends to hold its value.
The mixed performance of commodities in 2018
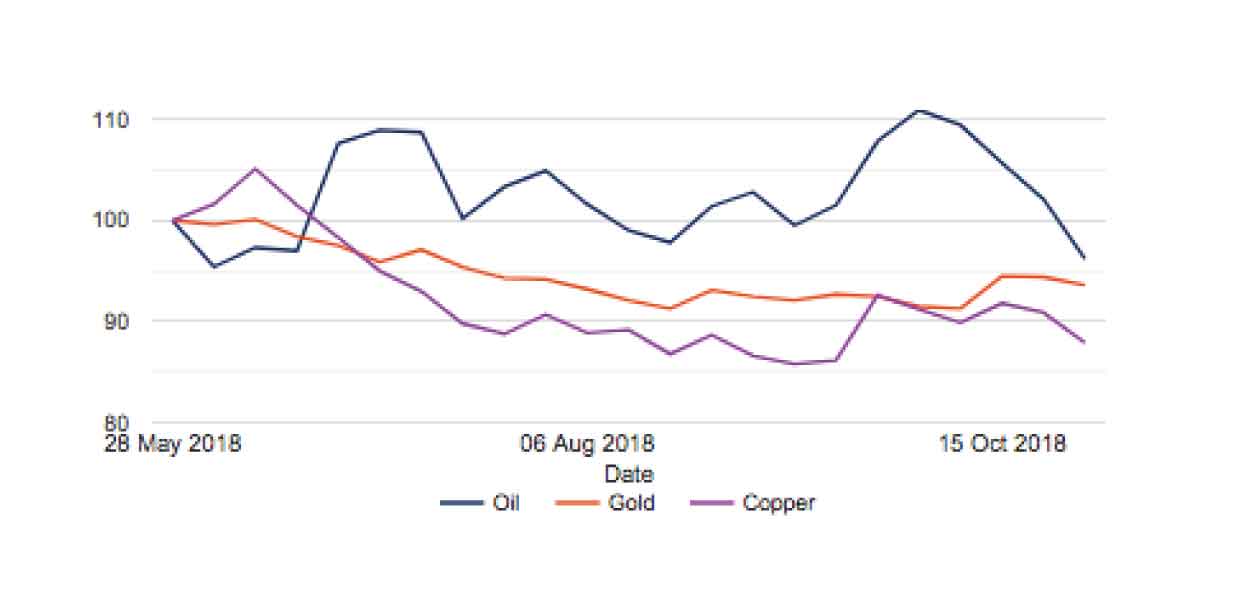
Please remember that past performance is not a guide to future performance and may not be repeated. (Source: Schroders, Thomson Reuters Datastream. Data correct as at 1 November 2018.)
The value of investments and the income from them may go down as well as up and investors may not get back the amounts originally invested.
- Money Lens: How would we cope with a recession?
- Money Lens: How 10 years of saving can beat 40 years
Important Information: The views and opinions contained herein are of those named in the article and may not necessarily represent views expressed or reflected in other Schroders communications, strategies or funds. The sectors and securities shown above are for illustrative purposes only and are not to be considered a recommendation to buy or sell. This communication is marketing material.
This material is intended to be for information purposes only and is not intended as promotional material in any respect. The material is not intended as an offer or solicitation for the purchase or sale of any financial instrument. The material is not intended to provide and should not be relied on for accounting, legal or tax advice, or investment recommendations. Reliance should not be placed on the views and information in this document when taking individual investment and/or strategic decisions. Past performance is not a guide to future performance and may not be repeated. The value of investments and the income from them may go down as well as up and investors may not get back the amounts originally invested. All investments involve risks including the risk of possible loss of principal. Information herein is believed to be reliable but Schroders does not warrant its completeness or accuracy. Reliance should not be placed on the views and information in this document when taking individual investment and/or strategic decisions. The opinions in this document include some forecasted views. We believe we are basing our expectations and beliefs on reasonable assumptions within the bounds of what we currently know. However, there is no guarantee than any forecasts or opinions will be realised. These views and opinions may change. Issued by Schroder Investment Management Limited, 1 London Wall Place, London, EC2Y 5AU. Registration No. 1893220 England. Authorised and regulated by the Financial Conduct Authority.